Wolfram 可视化的相关参考资料
Wolfram 可视化是 Wolfram 语言的一个组成部分。整个系统包含了六千多个内置函数,涵盖了计算领域的方方面面,所有内容被精心集成在一起,相互支持,完美地结合为一个整体。
核 心 语 言 与 结 构
数 据 操 作 与 分 析
可 视 化 与 图 形
机 器 学 习 与 LLM
符 号 与 数 值 计 算
高 等 数 学 计 算
字 符 串 与 文 本
图 与 网 络
图 像
几 何 学
声音与视频
地 理 数 据 与 计 算
知 识 表 示 与 自 然 语 言
与 时 间 有 关 的 计 算
科 学 和 医 学 的 数 据 与 计 算
工 程 数 据 与 计 算
金 融 数 据 与 计 算
社 会 、 文 化 与 语 言 数 据
文 档 与 演 示
用 户 界 面 构 建
系 统 操 作 与 设 置
外 部 接 口 与 连 接
云 与 部 署
最 新 添 加 的 功 能
所有资料与参考文档
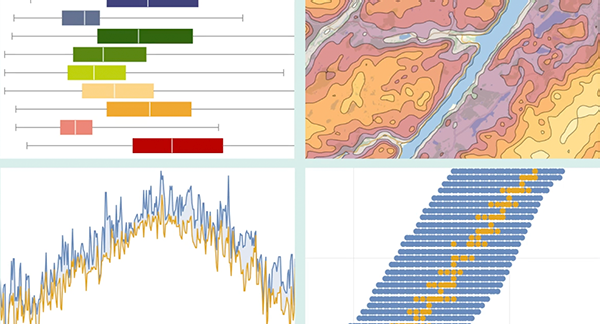
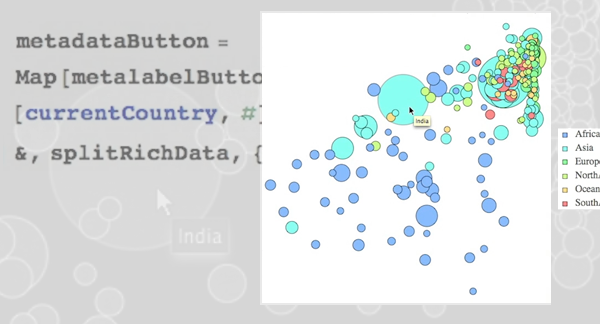
ListPlot ▪ ListLinePlot ▪ ListStepPlot ▪ StackedListPlot ▪ ListLogPlot ▪ ListLogLinearPlot ▪ ListLogLogPlot ▪ ListPolarPlot ▪ ListPlot3D ▪ ListPointPlot3D ▪ ListLinePlot3D ▪ ListDensityPlot ▪ ListDensityPlot3D ▪ ListContourPlot ▪ ListContourPlot3D ▪ ListSliceDensityPlot3D ▪ ListSliceContourPlot3D ▪ ListCurvePathPlot ▪ ListSurfacePlot3D ▪ ArrayPlot ▪ ReliefPlot ▪ MatrixPlot ▪ ArrayPlot3D ▪ TernaryListPlot ▪ DateListPlot ▪ DateListLogPlot ▪ TimelinePlot ▪ DateHistogram ▪ DateListStepPlot ▪ StackedDateListPlot ▪ ListVectorPlot ▪ ListStreamPlot ▪ ListVectorPlot3D ▪ ListStreamPlot3D ▪ ListSliceVectorPlot3D ▪ BarChart ▪ PieChart ▪ BubbleChart ▪ BarChart3D ▪ Histogram ▪ Histogram3D ▪ QuantilePlot ▪ BoxWhiskerChart ▪ AngularGauge ▪ HorizontalGauge ▪ VerticalGauge ▪ RadialAxisPlot ▪ PairwiseListPlot ▪ FeatureSpacePlot ▪ GraphPlot ▪ LayeredGraphPlot ▪ TreePlot ▪ Dendrogram ▪ ClusteringTree ▪ Grid ▪ Row ▪ Column ▪ Multicolumn ▪ GraphicsGrid ▪ GraphicsRow ▪ WordCloud ▪ ImageCollage ▪ ImageAssemble ▪ GeoListPlot ▪ GeoSmoothHistogram ▪ GeoRegionValuePlot ▪ NumberLinePlot ▪ DiscretePlot ▪ AnatomyPlot3D ▪ WaveletScalogram ▪ WaveletListPlot ▪ WaveletMatrixPlot ▪ ChromaticityPlot ▪ ChromaticityPlot3D ▪ Frame ▪ PlotStyle ▪ Filling ▪ Mesh ▪ ImageSize ▪ PlotLabels ▪ Labeled ▪ Callout ▪ PlotLegends ▪ Legended ▪ LineLegend ▪ BarLegend ▪ Tooltip ▪ StatusArea ▪ Inset ▪ Around ▪ IntervalMarkers ▪ Plot ▪ LogPlot ▪ LogLinearPlot ▪ LogLogPlot ▪ Plot3D ▪ ContourPlot ▪ ContourPlot3D ▪ SliceContourPlot3D ▪ DensityPlot ▪ DensityPlot3D ▪ SliceDensityPlot3D ▪ ParametricPlot ▪ ParametricPlot3D ▪ PolarPlot ▪ RevolutionPlot3D ▪ SphericalPlot3D ▪ RegionPlot ▪ RegionPlot3D ▪ ComplexPlot ▪ ComplexPlot3D ▪ ReImPlot ▪ AbsArgPlot ▪ DiscretePlot3D ▪ VectorPlot ▪ StreamPlot ▪ VectorPlot3D ▪ StreamPlot3D ▪ SliceVectorPlot3D ▪ RectangleChart ▪ SectorChart ▪ PairedBarChart ▪ PieChart3D ▪ BubbleChart3D ▪ RectangleChart3D ▪ SectorChart3D ▪ SmoothHistogram ▪ CandlestickChart ▪ InteractiveTradingChart ▪ RenkoChart ▪ GeoBubbleChart ▪ Manipulate ▪ Animate ▪ TabView ▪ ChartLabels ▪ ChartLegends ▪ Placed ▪ LabelingFunction ▪ LegendAppearance ▪ Style ▪ ChartStyle ▪ BarOrigin ▪ SectorOrigin ▪ BarSpacing ▪ SectorSpacing ▪ ChartElements ▪ ChartElementFunction ▪ PopupWindow ▪ Button ▪ Hyperlink ▪ IconData ▪





开始使用 Wolfram 可视化

通过 Wolfram|One 或 Mathematica 访问 Wolfram 语言

在云端探索交互式范例
Wolfram 助您构建

集符号计算、数据驱动的洞察力和深厚的技术专长于一身,我们致力于为人工智能时代提供解决方案